'/%3e%3cdefs%3e%3clinearGradient%20id='paint0_linear_6609_68599'%20x1='3.18225'%20y1='15.6908'%20x2='32.433'%20y2='20.6207'%20gradientUnits='userSpaceOnUse'%3e%3cstop%20stop-color='%230048ED'/%3e%3cstop%20offset='1'%20stop-color='%230DECD7'/%3e%3c/linearGradient%3e%3c/defs%3e%3c/svg%3e)
'/%3e%3cdefs%3e%3clinearGradient%20id='paint0_linear_6609_68609'%20x1='3.18219'%20y1='15.6908'%20x2='32.4329'%20y2='20.6207'%20gradientUnits='userSpaceOnUse'%3e%3cstop%20stop-color='%236896FF'/%3e%3cstop%20offset='1'%20stop-color='%230DECD7'/%3e%3c/linearGradient%3e%3c/defs%3e%3c/svg%3e)


Claude Sonnet 5.5: What's New and How to Use It for Work
Claude Sonnet 5.5 arrived on September 28, 2026. Anthropic positions it as a faster, more efficient upgrade to Sonnet 5 for well-defined work: coding, writing, charts, documents, slides, and spreadsheets. If you're wondering whether the update matters for your job, start with what actually changed—then try it on a task whose source material and expected result you can check.
What's new for everyday work?
Anthropic says Sonnet 5.5 generates output more than 30% faster than Sonnet 5. In its tests, the model also used fewer tokens and cost up to 30% less per task. Its API list price, however, remains $2 per million input tokens and $10 per million output tokens. These are model-generation and API-usage figures, not a measure of how long it takes a team to finish a report.
Anthropic also tested a workflow much closer to the one above: it supplied a public company's quarterly earnings materials, earnings-call transcripts, and a slide template, then asked for a ten-slide operating review. Two experts judged the first draft ready to send. That's one internal example, but it shows how much the quality of the brief and source material matters.
Beyond that example, Anthropic reports clearer writing, stronger chart understanding, and better adherence to slide templates. It also reports big gains in coding evaluations, though a coding benchmark doesn't tell you how accurate your financial deck will be. Sonnet 5.5 is available in Claude's web and mobile apps and on developer platforms. Anthropic still positions Opus 5.5 above it for complex, open-ended work that requires sustained judgment.
For a first try, choose a task with a clear question and files you know well. A monthly review is a good example: you can check whether the draft explains the figures or merely sounds convincing.
A small example: what did the campaign change?
Take these hypothetical month-end figures:
| Metric | Last month | This month |
|---|---|---|
| Revenue | $120,000 | $138,000 |
| Orders | 2,000 | 2,300 |
| Average order value | $60 | $60 |
| Ad spend | $20,000 | $25,000 |
Revenue and orders are both up 15%; average order value is flat. Ad spend is up 25%. That's enough to say spending increased faster than sales. It isn't enough to credit the campaign with all the growth, or to say profit improved. We'd need attribution and margin data for those claims.
Before prompting, gather the two monthly exports, campaign notes, metric definitions, and the actual question leadership must decide. Check whether “revenue” means the same thing in both files. A report based on payment date and a spreadsheet based on order date may disagree without either being wrong.
Then ask for a draft that keeps the uncertainty visible:
Using these two monthly exports and campaign notes, write a one-page operating review for leadership. Start with three findings supported by the files. For each important number, name the source and reporting period. Separate documented explanations from possible causes. Close with the decision about next month's ad budget and the information still needed. Do not treat revenue growth as profit growth.
When the draft comes back, trace the three most important numbers to their original rows. Check that it hasn't turned “the campaign ran during the increase” into “the campaign caused the increase.”
Take the approved story into the meeting
Once the report has been reviewed, the presentation has a job: make the conclusion and decision easy to follow, not just divide the report across slides.
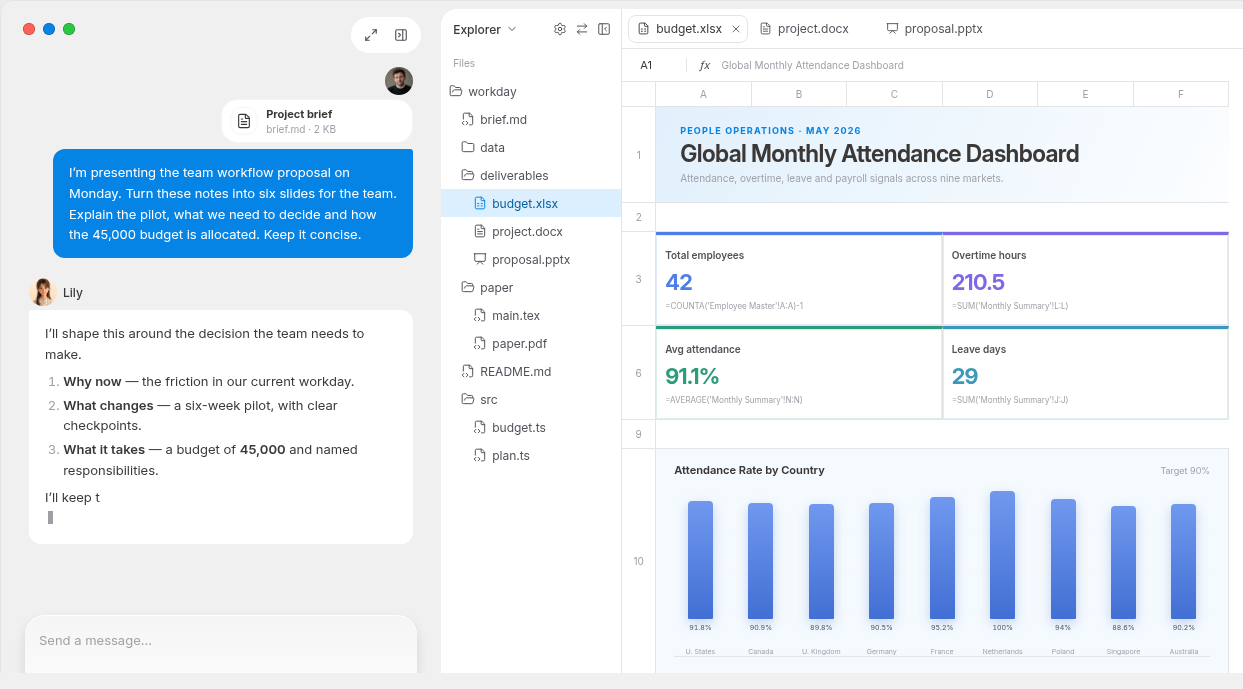
Turn the approved review into six leadership slides: the headline, revenue and orders, ad spend, what the evidence explains, decision options, and next steps. Give each slide a conclusion-led title, one main chart or table, and brief speaker notes. Keep the dates and definitions visible. Use our template if provided; flag missing evidence rather than filling it in.
“Revenue rose 15%, while average order value stayed flat” is a better title than “Monthly performance.” Don't add a profit chart without profit data. If the team needs to edit the deck, ask for an editable file and open the actual export before sending it around.
The same goes for the workbook. If next month's numbers will be added, ask for separate source-data, calculation, and summary sheets. Preserve the original values, use formulas for month-over-month changes, and label missing numbers differently from zeros. Check the export options in the Claude product you're using, then open the finished file to make sure the formulas and editing features work as expected.
When is Sonnet 5.5 a good fit?
A recurring report with known inputs, audience, and output is close to Anthropic's description of a well-scoped everyday task. A broad strategy question with conflicting evidence and no settled decision is different; Anthropic says Opus 5.5 remains stronger for complex, open-ended work requiring sustained judgment.
For a report about a recent event, bring current sources: Anthropic's model specifications list June 2026 as Sonnet 5.5's reliable knowledge cutoff.
The model is one part of the job; gathering the right project context and carrying a reviewed report into a deck is another. If that is the part you want help with, MuseWork can use relevant material from work sources you authorize, such as Slack or Google Drive, to draft a report and then build a presentation from the findings you approve. Give it the timeframe, audience, and decision you need to support. For information beyond your own records, Deep Research is another place to start.
Start a report in MuseWork · Explore MuseWork apps
Sources: Anthropic's announcement; Claude Sonnet availability; model specifications; API pricing.