Operational Dashboards & Business Reporting

Turn sales, workforce, inventory, channel, and operating data into dashboards and reports teams can reuse every cycle.

Who it is for

  • Operations and finance managers
  • Regional sales and HR leads
  • Analysts supporting recurring business reviews

What you will deliver

  • Spreadsheet or dashboard with KPI summaries and trends
  • Monthly or weekly reporting pack for leadership
  • Reusable templates for ongoing operational tracking
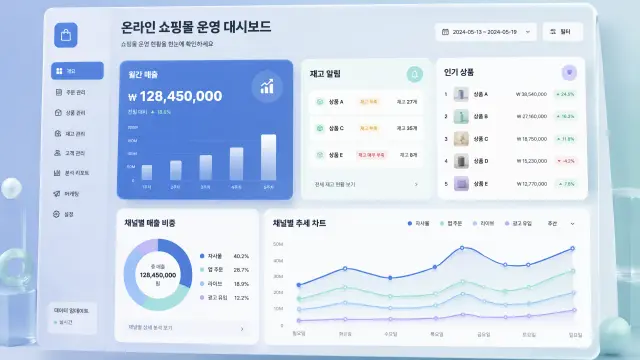
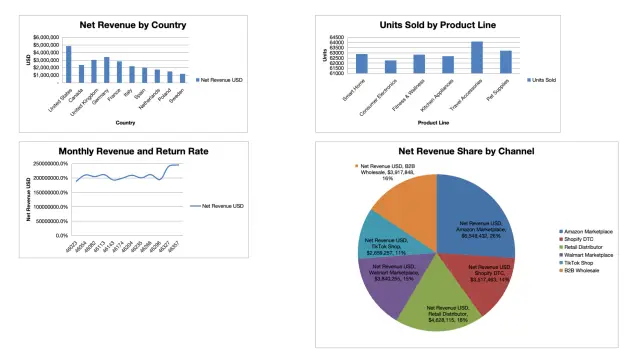
Regional Sales Performance Dashboard
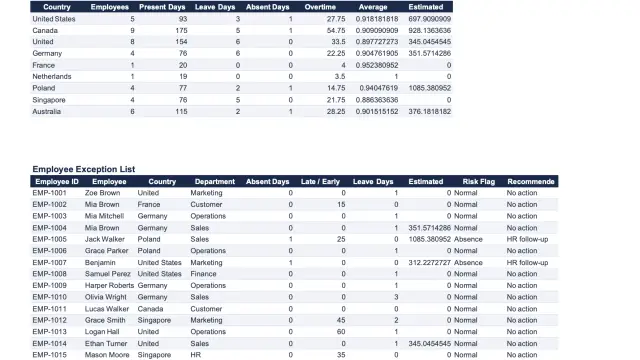
Global Attendance & Payroll Summary
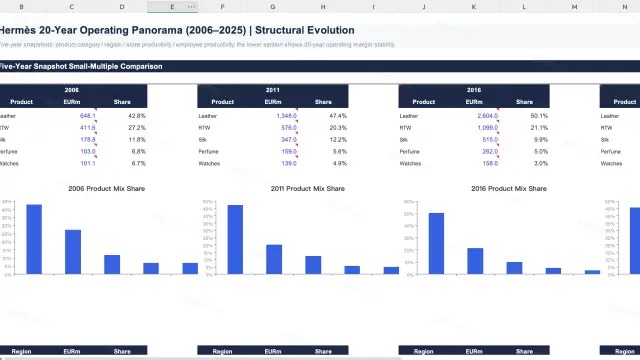
Hermès 20-Year Business Panorama
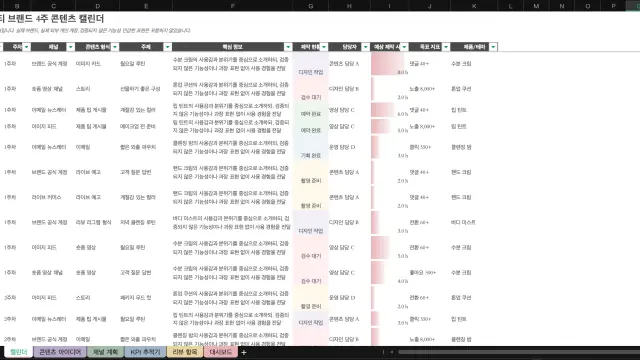
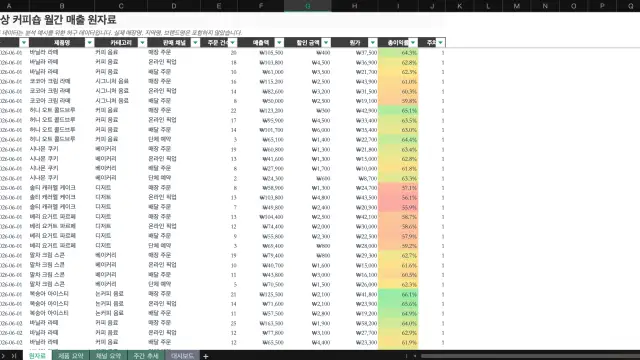
가상 커피숍 월간 매출 분석 보고서

Typical workflow

  1. Step 1

    Clarify metrics and reporting cadence

    Define the business unit, time period, KPIs, and audience for the dashboard or report.

  2. Step 2

    Structure the data model

    Organize raw inputs, calculations, exception flags, and segment breakdowns in a logical layout.

  3. Step 3

    Build summaries and visualizations

    Create roll-up tables, trend charts, and highlight sections that surface what changed and why.

  4. Step 4

    Review for operational action

    Add commentary prompts, alerts, and follow-up items so the report drives decisions—not just data display.

Related capabilities

  • Deep Research

    Analyze operational data patterns and contextualize performance against benchmarks or prior periods.

  • Website

    Publish interactive dashboards or reporting microsites teams can share and revisit.

Real examples

Related use cases

Start with this use case

Build an operations report